Showing posts with label flooding. Show all posts

Thursday, November 18, 2021

Sure It's Safe...Until It Isn't. Don't be a Scour Critical Bridge


Source: https://hickmanbridge.com/#

It's a bridge. Just like tens of thousands of other bridges across the country. It was pretty modern when I moved to my little town in the Great Valley of California. It crosses the Tuolumne River about 12 miles upstream of Modesto, and it's a fairly important transportation corridor that carries a lot of traffic including heavily loaded gravel trucks from the quarries upstream. And it's home to dozens of White-throated Swifts, European Starlings, and apparently 6,000 bats!

But I've been here for 30 years, which means the bridge is more than half a century old, and...it has a problem. A serious problem, a major vulnerability. In fairness in case you are worried, there's no disaster coming later in the post. The bridge didn't collapse or anything. But time (and a couple of major floods) had revealed an important structural deficiency. It is a "scour critical" bridge. You really don't want a bridge that is scour critical. It is the underlying cause in more than half the bridge failures in the United States.

The picture above was apparently taken in 2017 when the river last flooded (I kind of miss the days of too much water compared to what we have now). Notice how the columns are all under water. There are some pretty powerful currents coursing around the bridge supports.


Now, take a look at the bridge in low-water conditions (above and below). The columns supporting the bridge are connected to concrete pads. The foundation extends 16 feet into the ground, which consists mainly of loose river sediment (although there may be some fairly solid sandstone too, but I don't have access to the geological reports from the engineers for this project).

Major floods in 1997 and in 2017 apparently scoured out much of the sediment surrounding the columns, and threatened to destabilize the entire bridge (I recall the bridge being closed for many days during both floods).


The problem became pronounced enough that an attempt was made to reinforce the foundation with concrete Tetris blocks (below). 

As I became aware of the problem, the old bridge began to look more and more delicate and fragile. I had been driving over the bridge for three decades without giving a second thought to the safety of the span, and did not learn the details of the threat until signs suddenly appeared on the river trail announcing the closure of a section of the trail for the next three years (in 2019), and a bunch of beautiful old oak trees were unceremoniously chopped down. They were beginning construction of a new bridge.

The construction crews quickly built a temporary trestle just above river level (betting against another 100-year flood during the construction period). It was strong enough to hold up to three gigantic cranes at once. The new bridge is going to be wider with bike lanes and a pedestrian walkway (the old bridge was rather terrifying to walk or bike across). But most important, the bridge will be supported by pairs of columns that will extend more than 100 feet into the riverbed and into the bedrock below. Scour will no longer be a serious threat.


The new bridge was constructed rather quickly all things considered, and is opening for business just three days from now. The old bridge was shut down permanently about 10 days ago. The photo below is a webcam image from November 17.

Source: https://app.oxblue.com/open/stancounty/hickmanbridge

The bridge is going to always have an odd alignment, as it would have been economically disruptive to remove the old bridge first and then build the new one over a three year period. I am now extremely curious how they will proceed with the demolition of the old bridge. There is nothing in the promotional materials that indicates how they will do it. It seems unlikely that they'll blow it up, considering the proximity of the new bridge to the old one. Their timeline suggests six months or so to accomplish the task. Geotripper will be there to report if anything interesting goes on!


When I photographed the bridges side by side the other day, I was struck by the degree to which the old bridge sags. I had never really thought about it before, wondering if that was originally part of the plan, or did it 'sink' a bit over the years. It bothers me a little not knowing the answer!

There was a huge political scuffle over the infrastructure bill that was recently passed into law over the objections of one major political party (they even want to punish the 13 members of their party who voted for it),. There are tens of thousands of structurally deficient bridges all across our nation that are 'safe until they aren't safe'. This particular bridge didn't collapse as it could have, but there are many, many others that are more dangerous than we collectively think. We drive over them every day, never knowing about the cracks in the concrete, and the rusting superstructure that holds the bridges together. This new investment in our country's infrastructure should have been implemented years ago, but I'm glad we got it through when we did. We deserve better from those who would 'serve' over us.


Tuesday, March 15, 2016

A Far Too Rare Scene in These Parts in Recent Years: Flooding on Dry Creek

The latest storm to pass through Central California dropped 1.28 inches of rain in my backyard gauge, giving us 4.26 inches for the month of March, and about a third of a normal year's precipitation in the space of just ten days or so. By the time this last storm arrived, the watershed was saturated, and so Dry Creek...was not dry. It reached a peak flow of about 3,000 cubic feet per second yesterday.
 Unlike the Tuolumne River, there are no reservoirs like Don Pedro Dam to catch the runoff from the storms, so Dry Creek rises and falls quickly with the storms. The runoff shows two peaks, as there were a pair of storms over the weekend and Monday. The blue bars on the top show the amounts and timing of precipitation in the watershed, and the dotted line records the runoff. Notice the lag between the timing of the storms. This is the delay between the water falling from the sky, and the peak flow miles downstream. By analyzing the pattern and amounts of precipitation, predictions can be made as to the amount of runoff (the pink dotted line). If the storm is immense, graphs like this can be used to warn downstream residents to prepare for flooding, in terms of both the timing, and the discharge (water flow/height) of the river.
The rainy season is drawing to a close, although a few more storms will no doubt blow through. The drought is not over, but it is nice that all the precipitation arriving for the rest of the year is adding to the above-normal yearly rainfall total. If it could only be true of the snowpack too!

Friday, January 8, 2016

Unexpected Events of the Day: Floods and Foxes

There were some pleasant sights to be had today. They didn't seem at all related at first (foxes and floods), but in a way they were.

We've had rain, finally, in amounts that might make some small dent in the drought that has plagued California for nearly five years. I was headed into work and crossed Dry Creek in the Waterford area. Something was different: the creek was flooding. Not a vast flood, not one likely to produce widespread damage, but still, the banks and some of the oak tree trunks were underwater. It was a shock to see so much water after literally years of dry channels under this bridge.

Dry Creek (who comes up with these imaginative names?) heads in the lower foothills of the Sierra Nevada, so it is never fed by melting snowpack. Peak runoff occurs instead during intense rainstorm events. The creek flows into the Central Valley near Waterford and eventually joins the Tuolumne River at Modesto, for a total length of about 60 miles. It no doubt earned the name "Dry" a century ago, but in more recent years water flowed in the creek most of the time due to irrigation runoff. And during the drought of the last four years, it has been dry for months at a time, once again earning its name.
There have not been many floods during the drought years. The soil has been so parched that what little rain fell soaked into the ground, leaving little for surface runoff. The 2015-2016 water year has been different. November and December provided above-normal rainfall (and a Sierra snowpack), so when the January storms hit this week (the first attributed to El Nino), the ground was pretty well saturated. Close to 2 inches fell over the region on Tuesday and Wednesday, and the river peaked today at almost 1,000 cubic feet per second. As can be seen on the flood hydrograph below, the river will recede relatively quickly to tens of cubic feet per second within a day or so.
The last time Dry Creek really caught my attention this way was back in March 2011, when the discharge was around three times higher than it was today, at 3,000 cubic feet per second. Compare the difference in the picture below, taken from the same bridge. The river was even higher in the El Nino year of 1997, and with a probability of once in 500 years the creek may produce flows as great as 18,500 cubic feet per second. That would be something to see, but I wouldn't wish it on anyone.
Dry Creek in March 2011
The other unexpected event of the day was seeing a Red Fox out my office window. The fox lives on our campus so I've seen it two or three times before. It was running through an area slated to become an outdoor educational area for our Great Valley Museum of Natural History. The lab will emphasize the natural vegetation and animals of the valley. It was nice to see nature getting a bit of a head start!

Seeing these two different things reminded me that there is a small remnant of a natural ecosystem left in our valley, one that can never be completely obliterated by dams, farms, and cities. We can never truly control the rivers or droughts, and the tattered remnants of the original ecosystem will for the most part adapt and survive our invasion, albeit in small pockets here and there.

Monday, December 22, 2014

A California Geologist Observes a Flood in Oregon: Hilarity Ensues?

OMG, a gigantic river! The Umpqua River below Roseburg, Oregon
I'm really more of a desert rat. I hail from a dry valley in California, I take my students on extended field trips to places like Death Valley and the Colorado Plateau. The rivers that I know would be considered something like large creeks in a place like Oregon or Washington. I just don't see stuff like this where I live.
I've been traveling up the California coast into Oregon, and landslide problems forced us inland from the coast onto Interstate 5, and with the long day and the extra 200 miles added to our itinerary, I just flaked out and stayed the night in Roseburg along the Umpqua River. As noted in yesterday's post, the river reached flood stage last night, but just barely, rising a foot above the minimum considered to be a flood. But the amount of water! At the peak, the discharge at Elkton a few miles downstream was 131,000 cubic feet per second!

Here's why this is so ridiculous to me. In 1997 the Tuolumne River, which flows near my home, experienced its greatest flood in recorded history, with a peak flow of about 70,000 cubic feet per second. It could be such a rarity at that level that another such flood has but a one in three hundred or four hundred chance of happening in any given year. In other words, quite probably not in my lifetime or yours. And that extraordinary flood was barely more than half what I saw today on our journey down the Umpqua River to the coast.

I just don't often see rivers this big, or filled to this level. So my two hour drive turned into a four hours as we stopped to take pictures and stare at the flooding river.
It was clear that trees (and the odd telephone pole or railroad tie) were ripped from banks upstream. There was a lot of debris in the river. Roseburg had received about two inches of rain the previous day, but the mountains upstream got much more than that. The ground was no doubt saturated from the rains of the previous week, so much of the precipitation ended up in the river.
Graph of
A flood hydrograph, like the one above, is the tool that hydrologists use to analyze river flow and to predict possible flooding. It takes some time for rainwater and snowmelt to get into channels and flow downstream. By comparing the pattern, timing, and amount of precipitation in a given storm compared to storms of the past century (most U.S. rivers have been monitored for that long), they can predict hours in advance how high the floodwaters will reach, and for how long. For major rivers with huge drainage basins (like the Mississippi River), the warnings can be days ahead of the flood.

The Umpqua River flows into a large estuary at Reedsport, Oregon, and just upstream is a Roosevelt Elk viewing area. I would never have noticed such a thing on any other day, but the highway was actually a flood protection levee that prevented the river from flooding the meadows where the elk hang out. Driving along, I could see the Umpqua River just a foot or two below the level of the highway on the right, and the elk refuge on the left, about six or seven feet below river level! There was certainly some ponding as can be seen in the picture above, but if the highway weren't there, the entire scene above would be under at least four feet of water.

So this was a minor flood in the big scheme of things, barely rating mention in the local media. If you wonder what would really get their attention, how about the greatest flood ever recorded on the Umpqua River? It began on this very day fifty years ago, and the amount of water reached at least 260,000 cubic feet per second, about twice the flow of today's event. It's hard to even imagine.

So...your desert-living geoblogger got to get all fascinated about a river today. More rain is expected this week. If anything interesting happens, I'll let you know, and all my Pacific Northwest readers can quietly chuckle at my amateurish enthusiasm for BIG rivers.

Rain? In a Rain Forest? Exploring California and Oregon on the 50th Anniversary of the Biggest Flood Ever

Humboldt Redwoods State Park, California
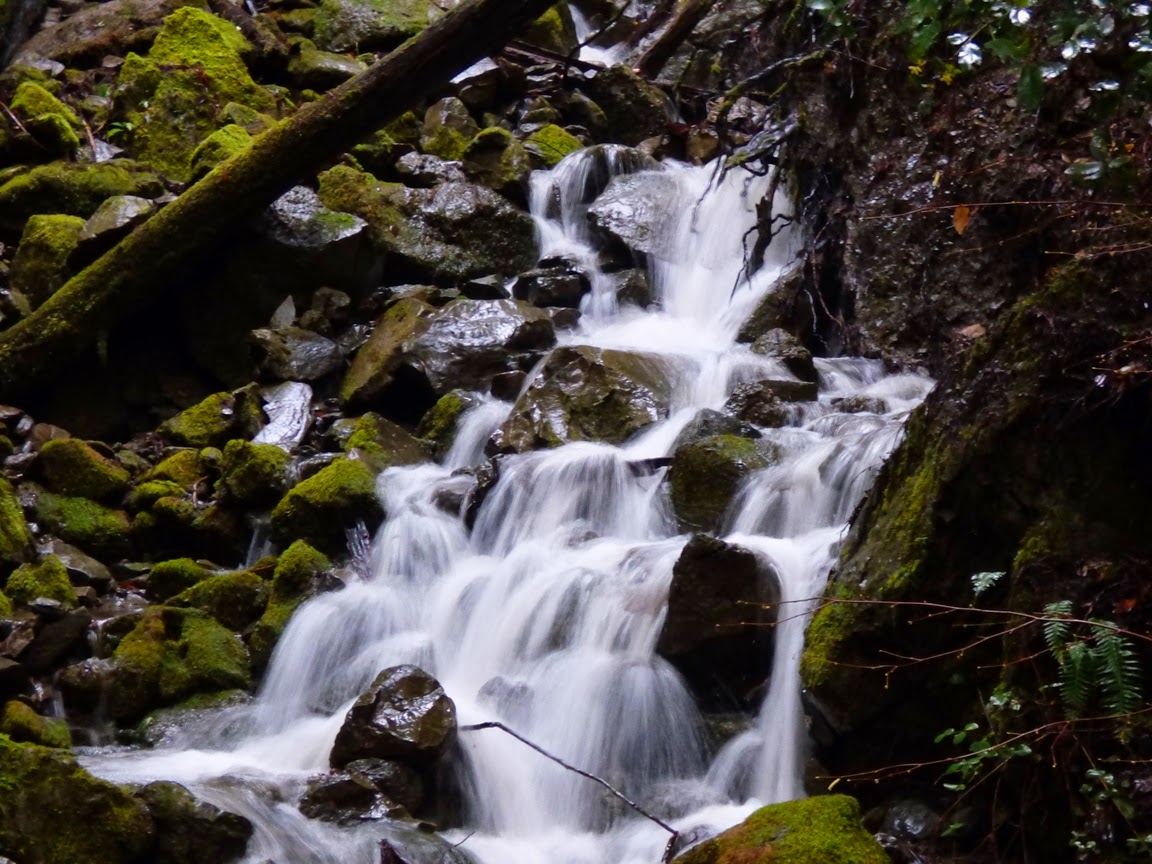
It starts with little cascades like this...
Humboldt Redwoods State Park
That grow into brooks like this, repeated thousands of times over...
Prairie Creek, Redwood National Park, CA
Which leads to this...
Prairie Creek Elk viewing area, Redwood National Park
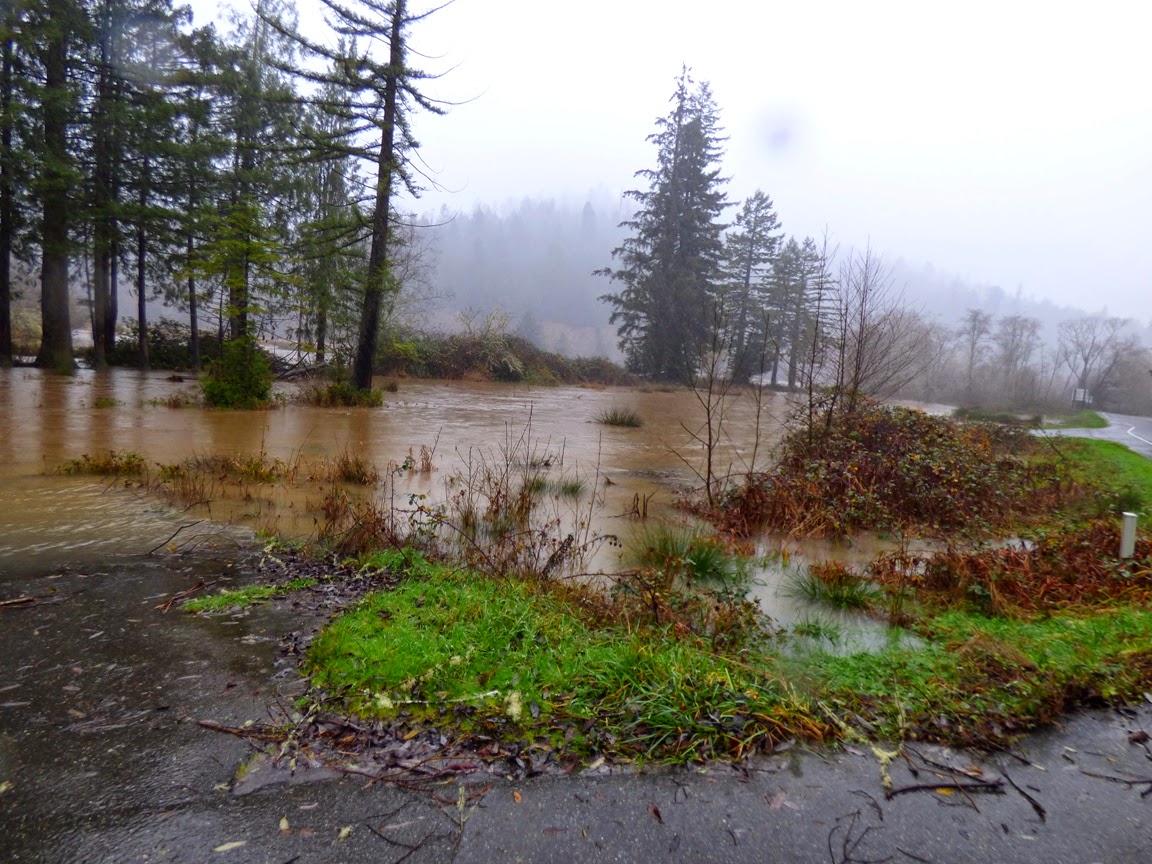
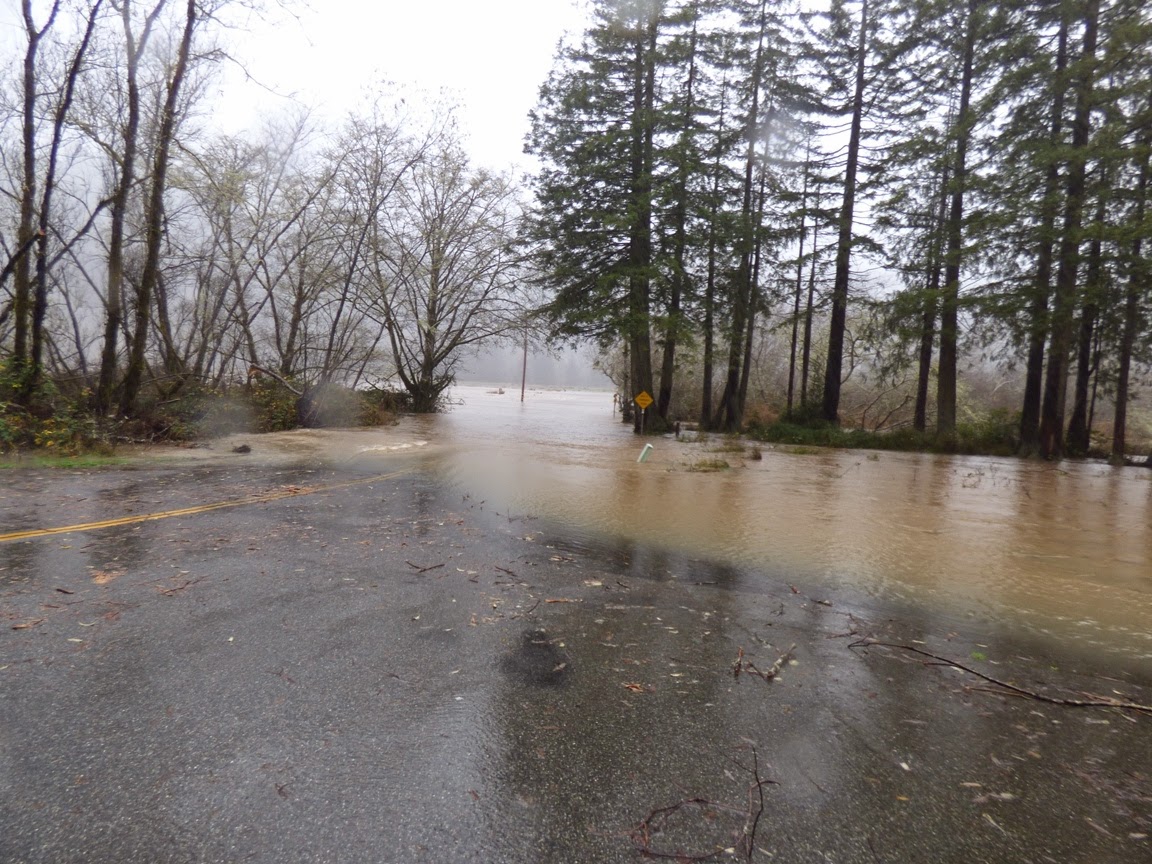
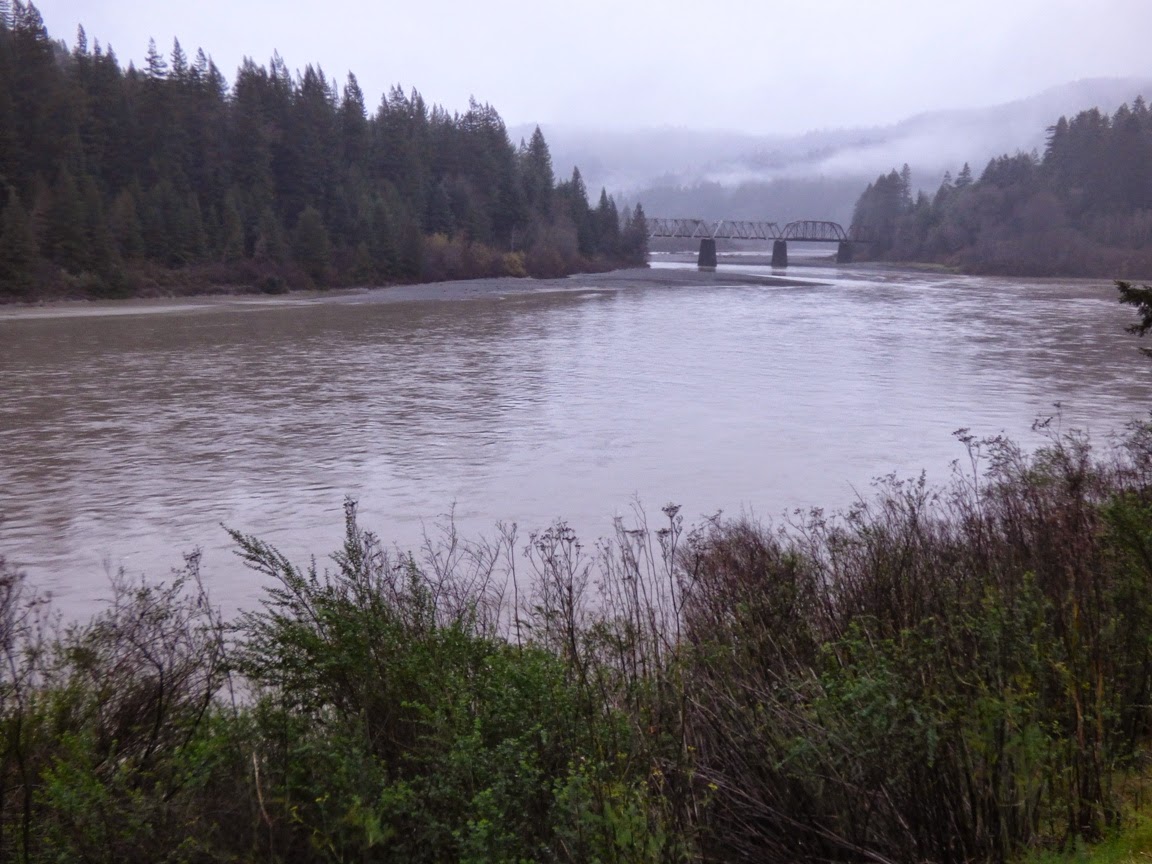
Our Christmas travels took us into the northwest of California and into Oregon, and as luck would have it, we drove right into a continuation of the storms that have been pounding the west coast this month. At home, we've already received more precipitation than all of last year's horrific drought totals. As we drove north on Highway 101, we watched the rain falling for hours, and soon, every waterway was filled with muddy water. It may be the first truly cleansing flows these channels have had in some time.
Eel River at Phillipsville
I don't think any records are in danger of being broken, but with the anemic levels of precipitation over the last three years, it was nice to see these rivers brimming with water. Now that I have access to some data, I am finding some impressive numbers stacking up. The Klamath River is flowing at 95,500 cubic feet per second, 961% of normal daily flow for this time of year. The Smith River reached 65,000 cfs for awhile (about 20 times normal), and Redwood Creek was around 11,900 cfs, about ten times normal.
Eel River, CA
The ultimate for our day was the Umpqua River near Roseburg, Oregon. Just downstream at Elkton, it is flowing at 131,000 cfs, a bit above flood stage. Compare to three or four days ago when it was flowing at about 5,000 cfs.
Umpqua River at Roseburg, Oregon

Umpqua River at Roseburg, Oregon


 A year ago at this time, the river was pretty much a pool...


Here is how hydrologists see these rivers, with a graph that shows the discharge (cubic feet per second) over a week's time. The effect of the latest storms is clear.
 Graph of

The water flows will undoubtably drop off over the next few days, but it is impressive to see what the rivers can do. Today is the 50th anniversary of the worst floods ever in the region, the 1964 Christmas Floods. In that flood there had been a cold snap where a great deal of snow had accumulated and the ground was frozen. Then, over several days around Christmas, a Pineapple Express storm dropped prodigious amounts of rain, which melted the snow, but did not melt the soil, so little of the rain was absorbed into the ground. Around three dozen people were killed, and several dozen villages were completely erased. Many dozens of bridges were destroyed, and numerous other towns were cut off for weeks.

Compare the numbers:

Klamath River today, 95,500 cfs, in 1964, 565,000 cfs.
Eel River today, 40,000 cfs, in 1964, 750,000 cfs.
Rogue River (Oregon) today: 23,500, in 1964, 200,000 cfs.

By some estimates, such a flood is estimated to happen maybe once in a thousand years.

Thursday, April 21, 2011

Springtime on the California Prairielands: Violence in a Gentle Landscape (and a gratuitous picture of a duck)

The gentle wind caresses the waving blades of grass...meadowlarks sing, frogs chirp...it's a serene day in the springtime of the Sierra foothills. Of course the science of geology holds no such sense of peace. Almost every aspect of this peaceful view speaks of violence, both in the recent past, and in the depths of time.

Take the layers revealed in the gentle slopes of the first picture above: a few terraces of dark rock on the distant skyline and some white exposures near the creek. These are two of the distinctive strata that make up much of the Sierra foothill slopes near the Central Valley, the Mehrten Formation and the Valley Springs Formation. The Mehrten layers resulted from numerous volcanic mudflows (lahars) and floods caused by eruptions of andesitic volcanoes in the vicinity of the Sierra Nevada crest in Mio-Pliocene time. Events that form layers like these are no picnic. Volcanoes of the 20th century like Mt. St. Helens and Mt. Pinatubo of the Philippines produced destructive mudflows that caused damage dozens of miles away from the volcanoes.

Likewise, the Valley Springs Formation speaks of volcanic violence. In Miocene time, around 20 to 30 million years ago, huge rhyolite caldera eruptions rocked the American west. A single eruption was capable of producing hundreds of cubic miles of volcanic ash that buried thousands of square miles under a stiflingly hot layer of what amounted to microscopic glass shards. The layers of the Valley Springs Formation record a number of violent eruptions, some relatively close, such as at the Sierra Crest, but some of them originated from ash explosions in eastern Nevada. Today, the differentially eroded layers provide shelter for burrowing owls and swifts along the small creek above.

Roadside runoff provides a bit of extra moisture supporting a thicket of monkeyflowers along Willms Road near Knights Ferry (above). But again, the landscape reveals a bit of geologic mayhem with the black boulders of the Table Mountain lava flow in the distance.

A favorite stop of ours on our seasonal treks through the foothills along Willms Road is a small stock pond a few miles south of Knights Ferry. At this time of year the flowers and birds are plentiful. The cattail marsh on the far shore was filled with chattering birds of all kinds. A peaceful, if raucous scene, but once again the present-day scene reveals a history of violence. The bits of rock sticking out on the lakeshore and far hillside are exposures of the Jurassic (yes, that Jurassic, the dinosaur period) Gopher Ridge Volcanics. These are andesitic and rhyolitic rocks that formed volcanic islands along subduction zones in the Pacific Ocean many miles away. Not only was there the violence of the original eruption, there were also the tectonic movements that carried the island arc into the western edge of the North American continent. The rocks were jammed into the continent, deformed, and metamorphosed into greenstone and slate.

The timing doesn't have to be measured in the millions of years. A look at the grass stuck in the fence (above) reveals that the road was inundated three and four feet deep during one of our intense rainstorms a month or two ago. The flooding obviously didn't do the road a whole lotta good either.


The frogs in the creek seemed fine, but unfortunately they reveal a certain level of violence, this time to the ecosystem of the foothills. Bullfrogs are an introduced species. They are voracious predators of other frogs and the native species have not been able to compete. They have driven the native species into a few refugia where the bullfrogs can't survive (even there, the native frogs have problems; they are eaten by the introduced species of fish as well).
I would almost be depressed by all the violence, but geologic processes are the very essence of drama, and the earth would be a boring (and probably unliveable) place if we didn't have earthquakes, volcanoes, plate movements and mountain-building. Just the same, I am ending with a picture of a duck that I saw hanging out along the water. As far as I know, the duck is not a terrifying animal unless you happen to be a snail in the creek....

Friday, March 25, 2011

What Does An Urban Small Stream Flood Advisory Flood Look Like?

It looks kind of like this....

Dry Creek has its headwaters in the foothills of the Sierra Nevada north of Modesto Reservoir. It flows southwest through the farmlands into the town of Modesto, where it joins the Tuolumne River. Dry Creek, despite its name, is rarely dry. Prior to agricultural development in the last century it was indeed dry for much of the year, but since the irrigation began, seepage keeps water in the creek for most of the year. But rarely is there more than a few cubic feet per second.
Dry Creek is an unregulated drainage, meaning there are no dams or other measures to control floodwaters. It normally isn't a problem, but every couple of years events conspire to cause problems. This week was one of those weeks. The ground is saturated from weeks of above-normal precipitation, and we had a violent wet storm yesterday that dropped several inches of rain and hail in the foothills.
The creek won't stay high for long, but for a few hours today, the flow was over 3,000 cubic feet per second. By comparison, the usually much larger Tuolumne River (with the headwaters many miles away at the Sierra Nevada crest) is at flood stage at 9,000 cubic feet per second. With this discharge, some properties in downtown Modesto may be flooded. Pretty big numbers for a little podunk gully. I would have shown "before/after" pictures, but I never think of taking pictures of the creek when there is no flooding going on.

Stream data comes from NOAA, found here.

Wednesday, June 9, 2010

What Those Irresistible Numbers Looked Like in the Real World...

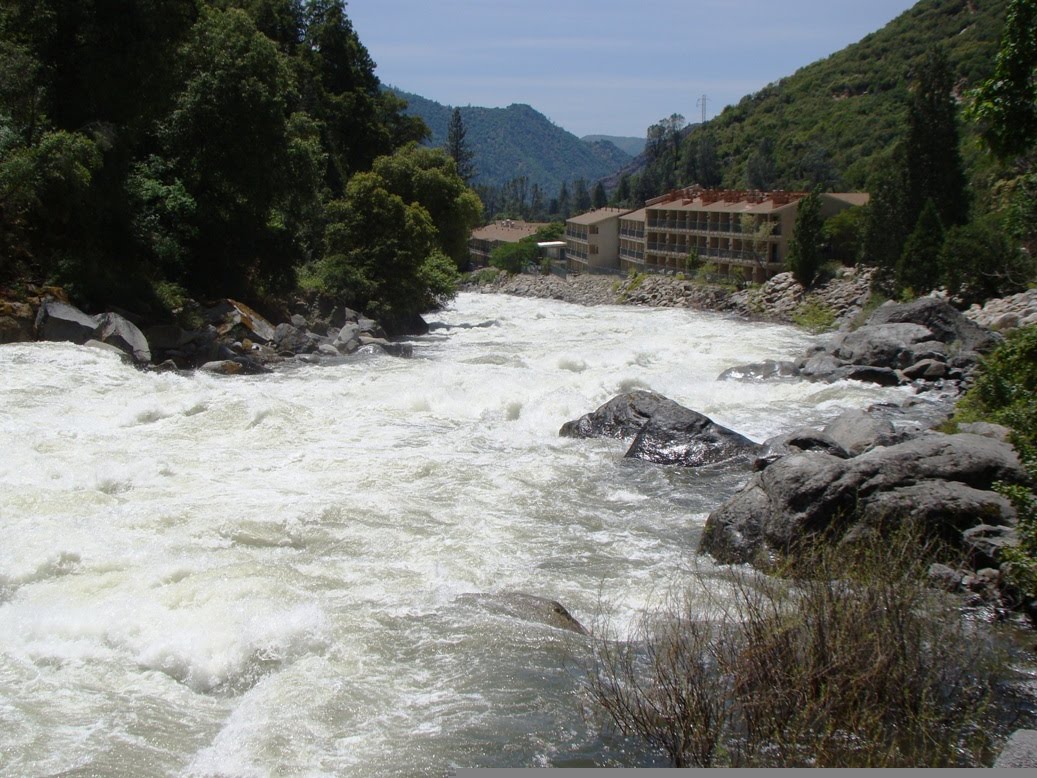
I really wonder what the consulting geologist told them about the history of the Merced River here? That's a pretty big resort complex on the western border of Yosemite National Park. They have lots of river view rooms, but still, that berm doesn't seem like the most secure defense against the major floods that are sure to come. But then, I'm not a consulting geologist...

I took a trip up Highway 140 along the Merced River to take in the highest runoff of the season (the irresistible numbers that caused me to hit the road). The flow spent two days at record levels for early June, at about 7,000 cubic feet per second (normal is about 2,000 cfs). I comment on the placement of the resort because during the flood of 1997 (admittedly a 200-300 year flood), river discharge at this location was more on the order of 24,000-25,000 cfs, and the highway was inundated in places, and literally removed in others.

It was a wonderful day for exploring...the grass was turning brown, but many slopes were still covered with blooming wildflowers (lots of pink and blue, the poppies are gone now), and the roar of the river was invigorating. As we approached the boundary of Yosemite National Park (below), the first of the ephemeral spring waterfalls started appearing.

We kept getting distracted by the sights and didn't arrive in Yosemite Valley until the early afternoon, but we kept busy through the sundown and twilight. Many pictures are coming; below is a preview of what we saw of the Merced River in Yosemite Valley...the reflection of the sunset on a flooded meadow at the Swinging Bridge picnic area. The water was all the way up to the base of the bridge, and a ranger on patrol mentioned that about midnight, the flood surge actually covered the top of the bridge.
Needless to say, it was closed, but there is always someone ready to jump over the barriers..

Sunday, February 8, 2009

One of Life's Ironies: Yesterday at Death Valley


So...my previous post concerned the horrific drought we are facing here in California, with a third straight year of below average rainfall, less than half of normal in many places. And yet, one place in California has been hit this weekend with way more of the wet stuff than they need, with serious consequences: Death Valley.

Death Valley National Park (the climate station at Furnace Creek anyway) is recognized as the driest place in the United States, with an overall average rainfall of 1.92 inches a year (a bit more in the last 30 years, about 2.54 inches). So how many places in the world can you think of that can get half of a year's average precipitation in one day? That happened yesterday at Death Valley, as they got 0.96 inches (on top of about 0.20 inches the previous day). And two more storms are due this week.

That doesn't sound like very much to anyone who lives in a more humid climate, but in a desert, nothing holds the water back...no soils to speak of, no plants. Gullies and gulches are filled with loose rocks and gravel that transform into mudflows when water thunders off the barren slopes above. According to the morning report, virtually all roads within the park save one, paved and unpaved, were closed due to flood damage. Six feet of mud covers Badwater Road where it crosses the Gower Gulch alluvial fan. Roads are completely washed out in some areas.

So, the place in California best adapted to practically no rain is the one place that has way too much of it. But at least much of the state is due for precipitation for much of the coming week, and maybe we can make a dent in the precipitation deficit elsewhere.

As for my own plans, well, anyone want to guess where I am scheduled to take 35 students and volunteers on Thursday? If you guessed Death Valley, you would be right. I wonder how much we will be able to see? One of the nice things about California is that it is very big, and we have alternatives if the roads are still closed. If DV is unavailable, we can check out the Mojave Scenic Preserve, with the giant Kelso Sand Dunes, the Providence Mountains, Pisgah or Amboy Craters (recent cinder cones), and Mitchell Caverns State Park.

Anyone with other ideas, I'm all ears! Today's photo is me contemplating rain at Death Valley in 2005, another wet year. The Stovepipe Well Dunes are visible in the distance (picture by Laura Hollister, I think....).