Showing posts with label Eel River. Show all posts

Monday, December 22, 2014

Rain? In a Rain Forest? Exploring California and Oregon on the 50th Anniversary of the Biggest Flood Ever

Humboldt Redwoods State Park, California
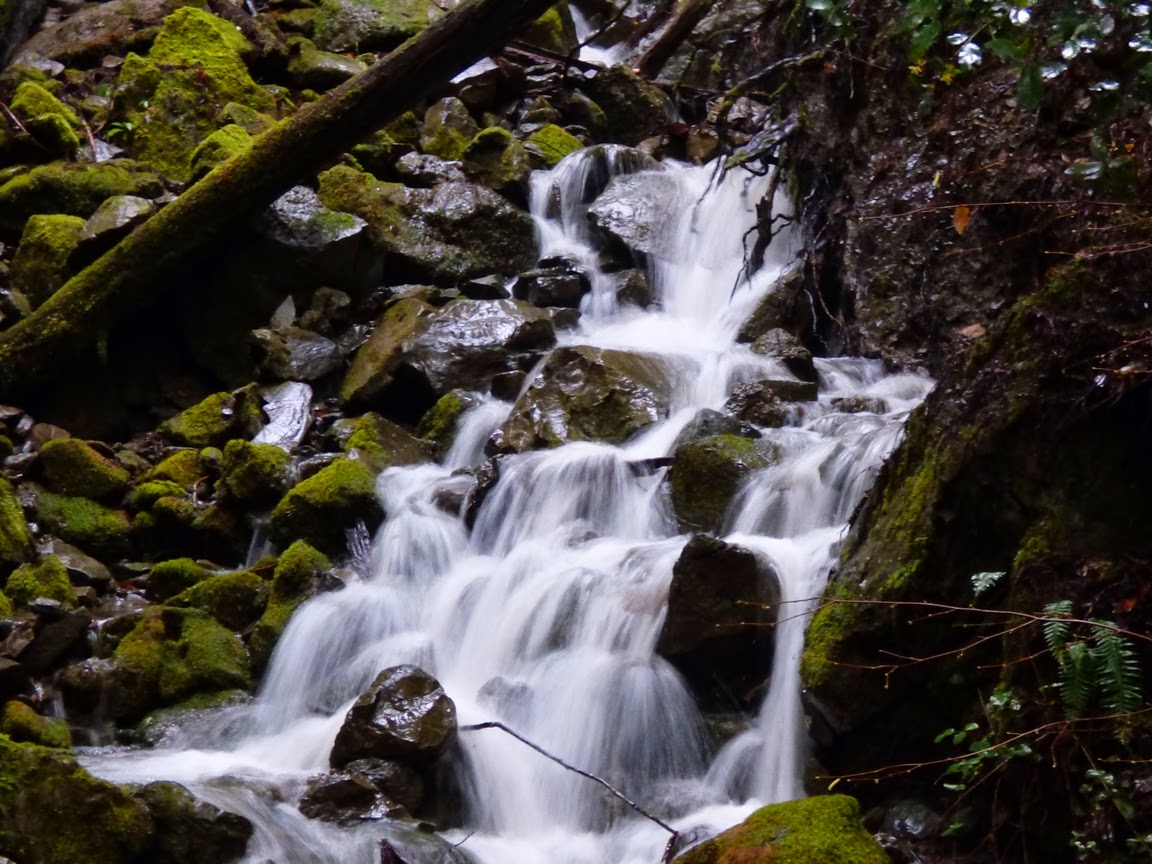
It starts with little cascades like this...
Humboldt Redwoods State Park
That grow into brooks like this, repeated thousands of times over...
Prairie Creek, Redwood National Park, CA
Which leads to this...
Prairie Creek Elk viewing area, Redwood National Park
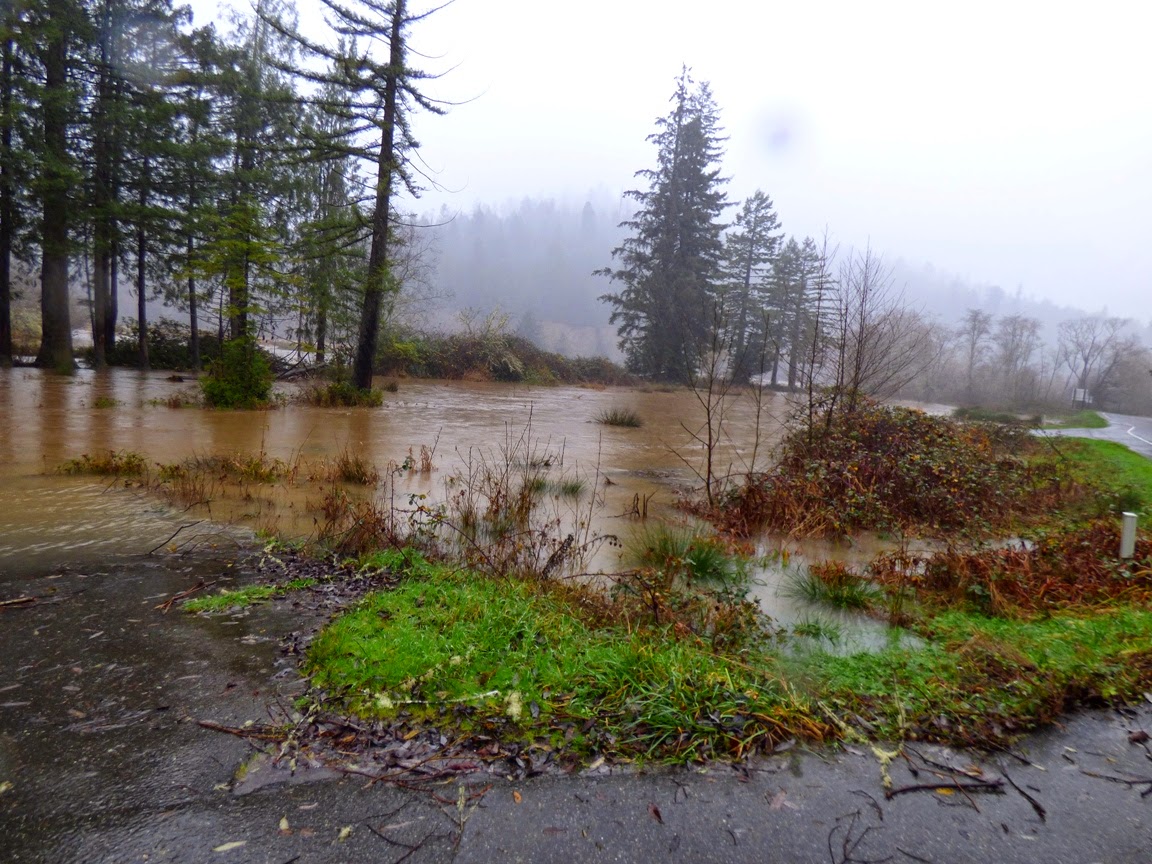
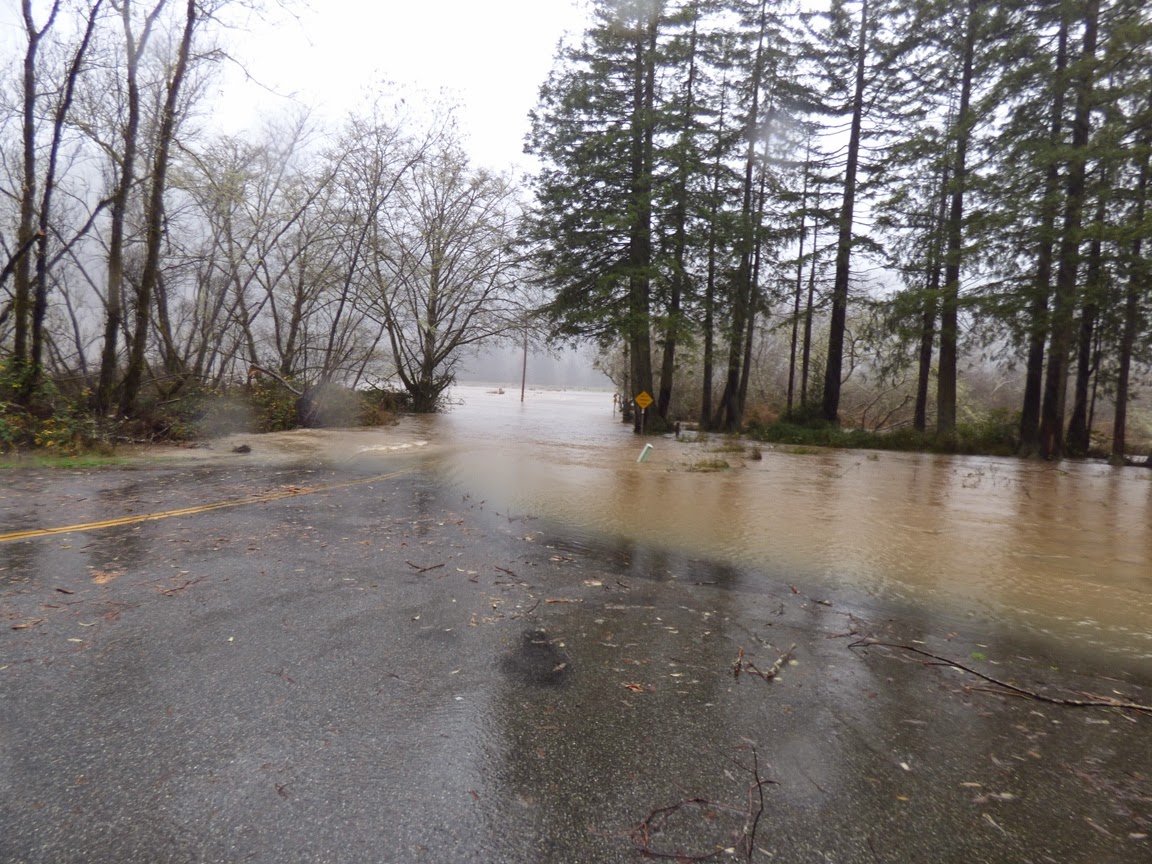
Our Christmas travels took us into the northwest of California and into Oregon, and as luck would have it, we drove right into a continuation of the storms that have been pounding the west coast this month. At home, we've already received more precipitation than all of last year's horrific drought totals. As we drove north on Highway 101, we watched the rain falling for hours, and soon, every waterway was filled with muddy water. It may be the first truly cleansing flows these channels have had in some time.
Eel River at Phillipsville
I don't think any records are in danger of being broken, but with the anemic levels of precipitation over the last three years, it was nice to see these rivers brimming with water. Now that I have access to some data, I am finding some impressive numbers stacking up. The Klamath River is flowing at 95,500 cubic feet per second, 961% of normal daily flow for this time of year. The Smith River reached 65,000 cfs for awhile (about 20 times normal), and Redwood Creek was around 11,900 cfs, about ten times normal.
Eel River, CA
The ultimate for our day was the Umpqua River near Roseburg, Oregon. Just downstream at Elkton, it is flowing at 131,000 cfs, a bit above flood stage. Compare to three or four days ago when it was flowing at about 5,000 cfs.
Umpqua River at Roseburg, Oregon

Umpqua River at Roseburg, Oregon


 A year ago at this time, the river was pretty much a pool...


Here is how hydrologists see these rivers, with a graph that shows the discharge (cubic feet per second) over a week's time. The effect of the latest storms is clear.
 Graph of

The water flows will undoubtably drop off over the next few days, but it is impressive to see what the rivers can do. Today is the 50th anniversary of the worst floods ever in the region, the 1964 Christmas Floods. In that flood there had been a cold snap where a great deal of snow had accumulated and the ground was frozen. Then, over several days around Christmas, a Pineapple Express storm dropped prodigious amounts of rain, which melted the snow, but did not melt the soil, so little of the rain was absorbed into the ground. Around three dozen people were killed, and several dozen villages were completely erased. Many dozens of bridges were destroyed, and numerous other towns were cut off for weeks.

Compare the numbers:

Klamath River today, 95,500 cfs, in 1964, 565,000 cfs.
Eel River today, 40,000 cfs, in 1964, 750,000 cfs.
Rogue River (Oregon) today: 23,500, in 1964, 200,000 cfs.

By some estimates, such a flood is estimated to happen maybe once in a thousand years.

Thursday, December 27, 2012

A Bit of River Perspective: The Eel River in Northern California

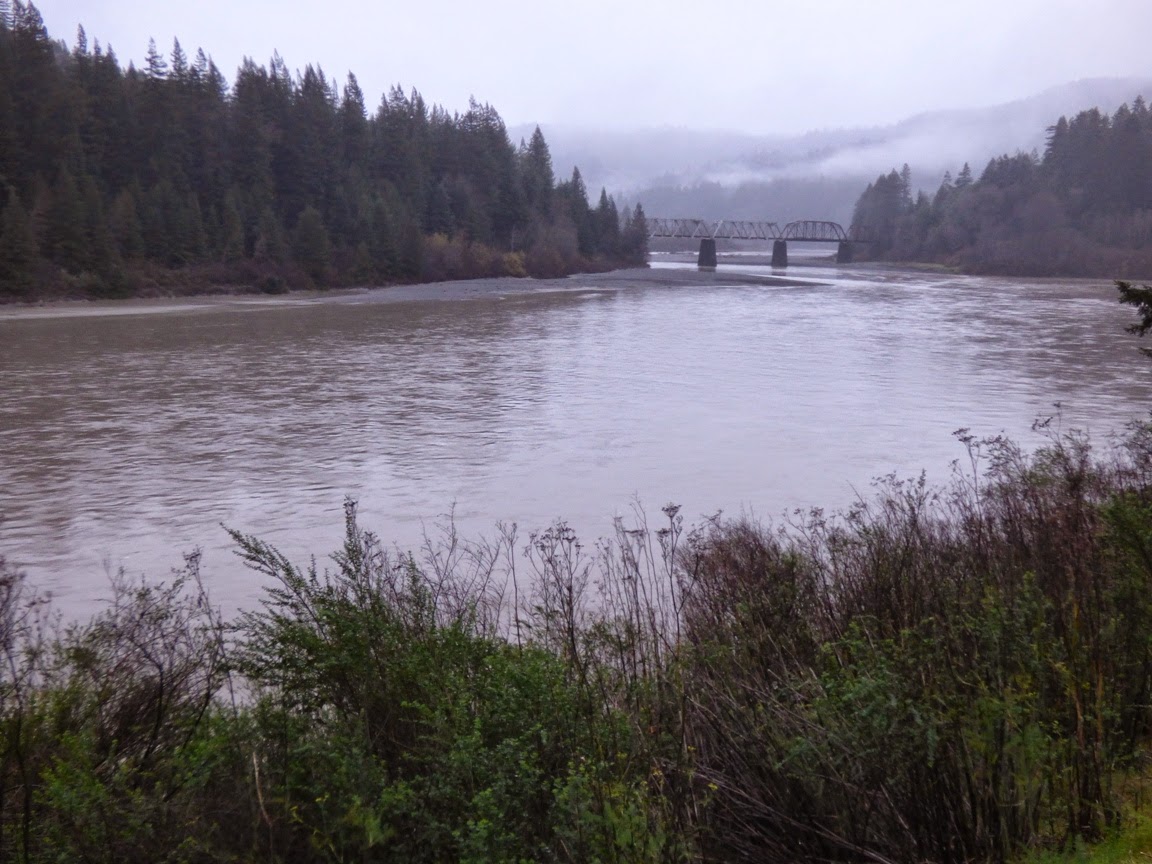
I was driving home from our Christmas visits with the family in central Oregon today. Since we were following Highway 101 through northern California's Redwood Country, we had a chance to look at the Eel River after several days of fairly intense rain. The picture above is a summertime view of the river from 2010 for sort of a baseline for comparing. As we drove along the river today I noticed it was filling the channel and inundating a fair number of trees. I wasn't thinking that it was flooding exactly, but it was full of sediment and moving fast. We stopped to grab a few pictures.
The river today was flowing at about 10,700 cubic feet per second. That would be flood stage on our own Tuolumne River, but was an unremarkable amount of water comparatively speaking. On Christmas Eve it was just over 20,000 cfs. We stopped at Miranda and had a bit of a shock. Some government entity had painted a river gauge on the bridge column to provide a bit of perspective...

You can click on the picture to see the writing better, but it essentially shows the depth of the water, which today was 14 feet deep. It's not considered to even be flooding until it reaches a depth of 33 feet, which would be a flow well in excess of 50,000 cubic feet per second. But a flood that size would be miniscule compared to what happened here in 1964; the water depth at Miranda was 46 feet, equivalent to 200,000 cubic feet per second. Downstream at Scotia where several forks of the river had combined, the water topped out at an unimaginable discharge of 752,000 cubic feet per second.
Needless to say, the damage was incredible, with entire towns being washed away. According to the Department of Water Resources, the North Coast rivers dumped 10.4 million acre-feet of water into the Pacific Ocean in six days. For comparison, Lake Powell on the Colorado River, a 186 mile long reservoir, holds 27 million acre feet. The average yearly flow of the Colorado is 14 million acre feet.

Perspective....