Showing posts with label seismometer. Show all posts

Thursday, August 29, 2019

The Seismometer Has Gone Crazy! What's Going On?? (Don't worry, no disasters)


Nothing like putting up a seismometer going crazy to be accused of click-baiting. I mean, what's going on? Is it harmonic tremor, the movement of magma near the surface, ready to cause a catastrophic eruption? Is it a new earthquake swarm? Nah, it's not any of those things. It's education in action.

Our seismometer is a simple version, and the detector is right there in the geology storeroom on the third floor of our science building. It picks up the foot traffic in the corridor outside, so when classes began this week, the unit faithfully recorded the arrival of hundreds of students for the new semester. The large "earthquake" at the very bottom is the exodus of my students at the end of the evening from their class in physical geology.

Welcome all to the new semester!

Saturday, December 31, 2016

Seismic Records from the Nevada Earthquake Swarm, as Recorded at Modesto Junior College

My Twitter feed and text messages went crazy the other night, early in the morning of December 28. For the first time in a number of years, an earthquake was felt widely in the Modesto area as a series of magnitude 5+ quakes struck an isolated region between Hawthorne, Nevada, and the ghost town of Bodie in eastern California. The first two quakes, both measuring 5.7 on the magnitude scale struck within four minutes of each other. A magnitude 5.5 event followed about an hour later. More than a hundred aftershocks, ranging as high as magnitude 4, have taken place in the last few days.

The quakes caused only minor damage, mainly to older buildings in Bodie, and I have heard no reports of any injuries. But dozens of my students and colleagues felt the quake in areas ranging from Fresno , the Bay Area, and Sacramento. I was far away, in central Oregon, and it took me several days before I could get home and check our seismometer at Modesto Junior College. To my relief, there had been no power outages, and the unit was functioning just fine. It clearly caught the three magnitude 5 events, and one can see the magnitude 4.0 nearly hidden by the waves of the first event.
There is nothing fancy about the seismometer; it's really a teaching tool, and not part of any networks. It does a good job of catching major events worldwide, and most 4+ events in the California/Nevada region. There is a display monitor outside my lab (the unit is inside the storage area on the third floor of the Science Community Center), and visitors can get a reaction on the monitor by jumping up and down outside the window. The computer application allows me to isolate any recorded events and analyze them. The records can be stretched out to help distinguish different wave arrivals.

Above is the arrival of the first two events, still somewhat compressed to fit them on one page. It is clear that they were very close in magnitude. The third event, shown below, has been stretched out a bit to emphasize the individual waves (notice the minutes scale across the bottom to compare the two pictures).

The swarm took place in a complicated region east of the Sierra Nevada where numerous fault lines accommodate the motion of the Sierra Nevada block to the northwest. Strike-slip faults (both left and right lateral) are part of the structural framework. The Sierra Nevada is a solid mass of rock considered by some to be a microplate between the Pacific and North American plates. The area of the swarm is part of the broken up crust that formed in the wake of the northwest movement of the Sierra block. Swarms have occurred in this area in the past, including one in 2011 (the largest event in that one was a magnitude 4.4).
The University of Nevada, Reno has lots of information on the swarm at http://www.seismo.unr.edu/

Tuesday, January 26, 2016

Late to the Party, but here's the 7.1 Magnitude Alaska Earthquake as Recorded from Central California


An earthquake, large by California standards, but almost moderate by Alaska standards, hit on Sunday, January 24 southwest of Anchorage. It measured 7.1 on the magnitude scale (moment magnitude). The quake was on a strike-slip fault (lateral motion), and was thankfully relatively deep (128 km/80 miles). Deep is good because the waves had to travel 80 miles just to get to the surface; it's like being 80 miles away from the epicenter of a shallow quake. Because of this, the damage was minor.

Our recording device is a simple classroom demonstration seismometer, but it has proven capable of catching a good record of large distant quakes, and smaller local ones. It's available for less than $1,000 at science supply outlets like Wards Science.

Tuesday, March 11, 2014

California's 6.9 Magnitude as Recorded at Modesto Junior College


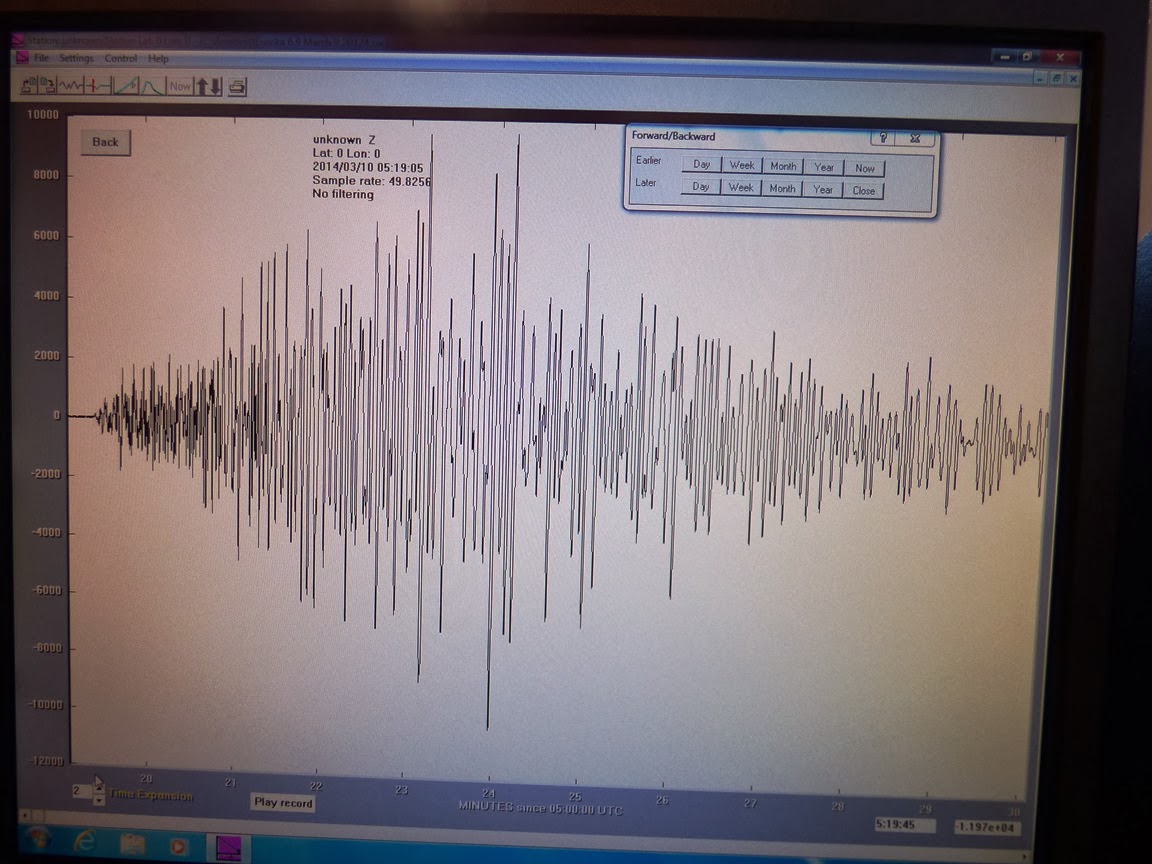
Here is California's 6.9 magnitude earthquake from last Sunday as recorded on our rather simple seismometer situated on the West Campus of Modesto Junior College. The unit is up on the third floor of the new Science Community Center, which is not ideal from a recording standpoint (the building is subject to all kinds of vibrations), but it's wonderful as an educational tool. We have one of the monitors up against a window where students can check for earthquake activity (and of course jump up and down to make their own earthquakes). The activity across the bottom of the record is the vibration of students walking by on Monday morning. This is the first major seismic event that we've recorded since installing the unit.

The horizontal lines on the monitor represent one hour increments, so the whole screen covers about 24 hours. The quake happened at 10:18 PM local time, and the shaking lasted for a good fifteen minutes. This doesn't mean that people were being shaken the whole time, because the actual humanly perceived shaking lasted only about 15 seconds. Instead, the ground continued to reverberate more slowly, so the movement was imperceptible. The waves would have continued all over the world and through the planet as well. They would have been detectable on a seismometer in India or Africa.

Here is the isolated and expanded version of the event. It covers about eleven minutes of the shaking:

Tuesday, March 15, 2011

The View of Japan's 9.0 Earthquake from Modesto, California, Part 2

The other day I provided a few screen shots of the seismic record that we captured in Modesto of the Sendai Earthquake in Japan. As I noted in that post, our seismometer is an old teaching model with deeply outmoded computer software, and all I was able to show were some screen shots. Well, I loaded the program on an older computer in the department, transferred the earthquake data to a floppy disk (remember those??), transferred the data onto a third computer where I could transfer the data to a CD-ROM, and finally was able to send the output to a printer. So today I offer the complete record. It's kind of astounding. The top picture is the initial minutes of the quake. You can see the amplitude of the waves rapidly increasing until they were off-scale. The notations on the left are the elapsed minutes, four minutes to the inch.

So what did the whole thing look like? At four minutes per inch, the print job took eight pages. I pasted them together and hung them on the wall, as seen below. This was a big earthquake, as if anyone needed to be told...