There are two ways to evaluate and monitor a drought. There's the usual method, where people use data on precipitation, snowpack level and streamflow discharge and all that, and it's all well and good. But there's also the Geotripper method of looking at Mt. Shasta in Northern California when I drive by, once at Thanksgiving, and again at Christmas. Folks can have a debate on which method is the most accurate, but it would probably be a stupid argument. I would end up telling people to listen to the science, not to their own local and limited observation (note: this is also an argument to use in the so-called "debate" about global warming).
Still, the Geotripper method has an advantage: one has to hit the road and look at Mt. Shasta, and it is always a beautiful mountain to observe. It is the second highest of the Cascades volcanoes (
14,179 feet; 4,321.8 meters), and the most voluminous of the stratovolcanoes (the lesser-known shields like Medicine Lake Highland are larger but shorter). And this year's observation is positive. There is a lot of snow covering the mountain already. Maybe the drought is easing a little bit?
 |
| Add caption |
Here's how it looked in November 2012. So obviously the Geotripper method works great...
The real data actually is a bit encouraging. In 2015, the entire state was in serious trouble. More rain fell in northern California this year, and the area under the most severe drought condition has shrunk. A little bit, anyway. 12% of the state, in the far north, is back to "normal". There is still a huge area classed as "exceptional drought" in central and southern California, and if we don't get some big storms down that way, the fires are going to get worse. The trees will continue to die by the millions. And our economic problems in the agriculture sector will continue to mount.
 |
| Drought conditions, February 2015 |
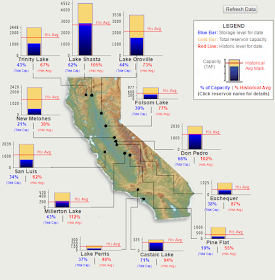
The news from our state reservoirs is also mixed. Lake Shasta and Don Pedro are presently where they are supposed to be at this time of year, but others are low. New Melones is at 38% of where it should be by this time. Others are in the 60-70% range.
It's early in the rain season, so there is hope. There's always hope...


er, the Mount Shasta glacier has been growing for years
ReplyDeleteAlso, conflating AGW with droughts is a mistake.
Two or three? years ago, We had a season that started out looking good, but inadequate cold and not enough precip that ruined the snowpack - the winter ended in December. The only reason we had decent irrigation that spring/summer was the record-level snowpack the previous winter.
ReplyDeleteShasta is almost the only mountain in the world with growing glaciers, and the process is related to increased evaporation and moisture in the air in this one area. The climate around the mountain has warmed along with everywhere else, and the glaciers are ultimately doomed as warming overwhelms the increased precipitation. http://www.foxnews.com/story/2008/07/09/mysterious-california-glaciers-keep-growing-despite-warming.html
ReplyDeleteDroughts happen in California, as I said, but they are intensified by the effects of global warming. The analogy is the use of steroids in baseball. Players hit home runs whether they are drugged up or not, but they hit more of them on drugs. Droughts are more intense in the same way. The true mistake is to cut back on research on global warming for purely political reasons and a blind belief in ideology. http://www.nytimes.com/2015/08/21/science/climate-change-intensifies-california-drought-scientists-say.html?_r=0
www.siskiyous.edu/shasta/env/glacial/exi.htm
ReplyDeleteWhich glacier are you pointing to as evidence that the "glacier" is growing. Those on the southward side of the mountain have been shrinking for many years.
Garry, how do you access/request the figure showing the graphs of the different reservoirs? I followed the link, which wouldn't work, but was able to access the individual graphs per reservoir. Still, I would prefer to see them together as in your figure.
ReplyDeleteThanks for your help, and blog!