Monday, January 30, 2017

What's the Most Incredible Thing You've Experienced? Memories of Baja in 1991 (and looking forward to August 2017)

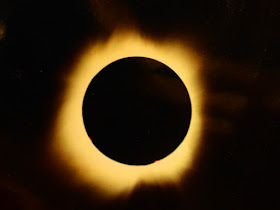
Totality of the solar eclipse of 1991 from San Jose del Cabo. The corona, an aura of plasma and gases, is only visible during totality. Photo by Dr. William Luebke.
What's the most incredible thing you experienced?

There are lots of answers to such a question, and many different contexts and meanings. I had an abrupt reminder tonight of one of the most incredible things I ever took part in. We're putting in new carpeting (no, that's not the incredible experience), so I've spent the week organizing 26 years of accumulated papers and books to clear the floors throughout the house. It's as much trouble as moving, only there's no truck to stuff everything in. I was close to finishing when I got into a cabinet that had been blocked by other boxes for literally years. There was an old photo album. I opened it and was immediately transported back to 1991 when I experienced a total eclipse of the sun at the tip of Baja California in Mexico.
The "diamond ring" effect just before totality as the last of the sun's disk disappears behind the moon. Solar prominences are jets of gas shooting from the sun's surface. Photo by Dr. William Luebke
The 1991 eclipse was going to be visible from mainland Mexico, the tip of Baja California, and Hawaii. I was in my third year of teaching at Modesto Junior College, the new guy (needless to say, I'm not the new guy in the department anymore; I'm actually the senior member). Our astronomy professor, William Luebke, had made plans to fly to Hawaii for the event, but I found out that a relative (the mother-in-law of my sister-in-law) kept a condominium in San Jose del Cabo that she was willing to let us use. We jumped at the chance. All we had to do was get there. There were five of us and flights were expensive, so we decided to borrow a school van and make the 900 mile drive to the tip of the peninsula.

The drive was quite the adventure, and if I can locate the slides and scan them, I will perhaps tell the story. But we made it, and settled in for a few days to prepare (and get sunburnt while snorkeling). We selected what appeared to be an abandoned condominium plot and set up shop.
Who IS that young man?
The hillside was perfect, commanding a twenty mile long view of the coast. Soon others gathered, including an entire busload of Japanese astronomy enthusiasts who said they had rented the entire plot for themselves. After a few minutes of delicate negotiations, they allowed us to stay.

The length of totality was going to exceed four minutes, one of the longest eclipses of the century. We had three or four telescopes with us, so Dr. Luebke could concentrate on photographing the entire event, while I and Mrs. Geotripper could work with a telescope of our own that we shared with the many people on the hillside. During totality, thirty or forty people were able to take a quick look.
The eclipse was unlike anything I had ever seen in my life. In the hours before totality (which happened around noon), the air grew stiflingly hot, over a 100 degrees. The skies were almost free of clouds, and the sunshine was blindingly bright. The moon started to move across the disk of the sun, and we had quite a bit of time to watch the passage. Before totality, the sky remained bright. But then the last flash of the "diamond ring" effect took place and the sky suddenly darkened.
Not just darker. Dark. Stars and planets suddenly became visible, and the temperature dropped 15-20 degrees. Looking at the sun without needing glasses, I had little trouble appreciating the meaning that the ancients applied to eclipses. It was otherworldly; I almost found myself chanting for the dragon to release the sun from its prison.
Yes, the picture below was taken with a flash. It was that dark. Then it began to end. Bailey's Beads, the first dots of sunshine, broke through canyons and mountain passes on the surface of the moon, and the sky turned bright again. In a few more minutes, it was over. We packed up and headed home the next day (a whole other adventure).

At the time, we knew that the next solar eclipse that would be accessible to us would not be until August of 2017. It seemed such a long time into the distant future. I had no idea the many changes that would take place in my life, but suddenly it is upon us, on August 21. The path of totality is shown on the map below. If you have any chance at all, make your way and have a look. It is one of the most astounding sights you will ever see.
By the way, it turned out that Hawaii would not have been a good idea. Thousands of people flew there to see the eclipse, but low clouds obscured the skies and the only people who saw it were at the observatories beyond the end of the closed road on Mauna Kea. We were incredibly lucky to have had perfect weather in Baja.

Friday, January 27, 2017

Is Trumpism/Pencism the New Lysenkoism? The Need to Defend Science From "Alternative Facts"

Drought-killed trees in Yosemite Valley, California

Imagine what it must have been like living under communist rule in the Soviet Union during Joseph Stalin's regime. I can't even begin to imagine the unspeakable horrors that led to the deaths of tens of millions of people for a variety of reasons, but events this week have brought to mind a particular episode that is unfamiliar to the public at large, but which had a profound effect on Soviet agriculture. It was no doubt among the reasons for the failure of the totalitarian rule over the Soviet Union. Why? Because they were never really able to feed their own people, especially wheat. The Soviets had plenty of arable land. Why did this happen? There were always profound inefficiencies in the Soviet economy, but the heart of the problem was a single man: Trofim Denisovich Lysenko.
Trofim Denisovich Lysenko, 1898-1976. Source: https://en.wikipedia.org/wiki/Trofim_Lysenko
How could one man do so much damage? It had to do with how science was done in the Soviet Union under communist rule. Scientific research, at least in agriculture, was done from the top down. The government decided what was true, and directed that research must confirm what the government knew was true. If that didn't happen, scientists and researchers faced arrest, re-education, and possible death. And in the Soviet Union, from the 1920s until 1965, Lysenko was in charge of agriculture.

Simply stated, Lysenko didn't accept the theory of evolution by natural selection. He denied Mendelian genetics or even the presence of genes in plants and animals. He instead believed an earlier hypothesis called Lamarkism as well as his own bizarre ideas about inheritance. In essence, he believed that organisms could pass down their experiences to their offspring. A simple model to illustrate this would be an experiment in which dogs had their tails surgically removed, generation after generation. After enough time had passed, puppies would start being born without tails. These were called acquired characteristics. In essence, he insisted that the best strains of cold-weather wheat could be achieved by repeatedly subjecting the seeds of warmer climate strains with cold temperatures. They would then acquire the ability to grow in colder climates.

And so, under his direction, farmers were ordered to grow inferior wheat strains for decades, and the results were no surprise. Production suffered, and over the years the Soviets had to import wheat from other countries, including the United States. The study of DNA, genetics, and natural selection continued unabated in other parts of the world, and agricultural yields ballooned as a result. Yet despite these failures, Lysenko continued as the Director of Genetics for the Academy of Sciences for decades. And he had true power. Under his reign, more than 3,000 geneticists who didn't toe the Lysenko line were arrested, and many of them were executed.
Athabasca Glacier in Jasper National Park in Alberta, Canada. The glacier has been receding for decades

So why are we talking about Lysenko tonight? I can barely keep up with the daily outrages of the new Trump/Pence administration, but one of the most chilling news during the transition period and inaugural week has been the attack on science and scientific research. Global warming and climate change have been declared to be false, and Trump officials have taken steps to end government research into this most pressing environmental issue. They have demanded the names of climate researchers at the Environmental Protection Agency, the National Park Service and other departments, suggesting a coming purge. They announced a gag order on dissemination of the results of research by government experts, even outside of government channels. They have attempted to restrict information flow via the social media. There have been hints of draconian budget cuts in scientific research.

The cause, of course, is not a belief in some other cause of warming. Many of Trump's followers deny that warming is even happening. Because Trump, Pence, and the others in the administration do not believe in global warming, they have decided that it must not be investigated. They are trying to use their position of power to alter the direction of scientific research to conform to their own preconceived beliefs. That runs absolutely counter to the trajectory and goal of scientific exploration, and very much counter to the role of science in America throughout its history. Scientific research and discovery has been a driver that has allowed the American economy to thrive. For a country to promote scientific research that is directed from above towards categorically wrong conclusions is courting disaster, and the implications are worldwide in scope.

I am encouraged at the response of the scientific community. There has been a concerted effort to protect and preserve the research that has been conducted in the past, and researchers are beginning to realize that they will have to become politically active, despite a tendency to avoid it in the past. Resistance has been growing in the social media. To be clear, this is not a Democratic-Republican issue, or a liberal-conservative issue. It is a battle between factual truths and willful ignorance. It is also an economic issue, as the opposition is richly funded by corporations who stand to profit handsomely by denying the existence of global warming. Unfortunately, we will all lose in the end.

I've tended to avoid politics in this blog, but that has to change now. Until the Trump/Pence administration acknowledges the critical role of independent scientific research, they must be challenged at every turn. The stakes are simply too high for Americans and the rest of the world. It doesn't matter what Trump and Pence believe. They may believe warming hasn't happened, but sea level will continue to rise anyway. Coral reefs will continue to die off. Glaciers will continue to melt. Storms will become more intense, as will droughts. The world will get hotter, and each year will decrease our chances to deal effectively with the issue. For Pence and Trump to be willfully ignorant about science is appalling. To ignore the advice and counsel of experts in the many fields of science is absolute folly.
Source: https://www.earthmagazine.org/article/comment-crazy-times-arctic

I fear we have entered into a new age of Lysenkoism. Yes, that is a term. And it would be a tragedy.

Thursday, January 26, 2017

Liveblogging the Deluge: The Post Mortem...Storms That Made a Difference

Don Pedro Reservoir on January 5 before the storms, elevation about 786 feet (76% of capacity).

The atmospheric river storms of January have finally subsided, and we are looking at kind of a new landscape across California. We had a couple of sunny days, so we headed up the highway to have a look at Don Pedro Reservoir on the Tuolumne River coming out of Yosemite. When we visited on January 5, the lake stood at 786 feet, which translates to 76% of capacity. That was 114% of normal for this time of year, which was a relief after five years of intense drought.
Don Pedro Reservoir on January 26 after two atmospheric river storms, elevation 813 feet (90% of capacity).

When we arrived yesterday, the lake stood at 813 feet, or 90% of capacity, which is 133% of normal. It is only 17 feet below the level of the dam. It could have been higher, but the dam operators have been maintaining constant outflows in the range of 7,000-9,000 cubic feet per second, a level that is just short of flood stage. Had they not done this, the lake could have overflowed and flooded downstream urban areas as happened in 1997.
Source: http://cdec.water.ca.gov/cgi-progs/products/rescond.pdf
It is a similar picture at the major reservoirs all around California. The monster reservoirs, Shasta and Oroville, are at more than 120% of normal for this time of year. San Luis Reservoir, the critical link in the California Water Project, is 103% of normal, and may fill for the first time in five years. A few are still low, most notably New Melones (68% of normal), and Trinity (84% of normal), but they are way up from where they stood before the storm.
Source: http://cdec.water.ca.gov/cgi-progs/products/rescond.pdf
The picture in my corner of the woods is brighter too. The Tuolumne River is running fast and cold, and in many places it covers practically the entire floodplain, and has done so for several weeks now. I believe that most areas downstream are not affected by the high flows (there is a history after all of flooding, and outflow from Don Pedro is regulated so as to prevent it). Instead the river is flushing itself of invasive hyacinth, which has been threatening numerous creatures and plants. Gravel bars are shifting and accumulated silt is being removed, providing better nesting areas for salmon and other fish species. Silt is being redistributed across the floodplain, rejuvenating the soils of the riparian areas. Groundwater aquifers in the vicinity of the river are being recharged.
Tuolumne River in Waterford, about 8,000 cubic feet per second

My rain gauge has been active. My friends in more humid regions may snicker a bit when I talk of how we've had 7.38 inches of precipitation in January. That might not seem like all that much but in 25 years of recording rainfall in Waterford, only two had greater amounts, 7.58" in 1995, and 8.60" in 2011.  We've had a year where that was the total for the entire season (7.26" in 2014). We've already passed the total rainfall normally received in an average year (14.69" so far compared to 13.92" average for the last 25 years).

But the real story? The snowpack.

At the height of the drought, we had a snowpack that was 5% of normal. 5%! It was both unbelievable and appalling.
Source: http://www.sacbee.com/news/state/california/water-and-drought/article124305504.html
This year started out with some good healthy storms, but the January events threatened to undo the progress. On the first of January, the statewide average was 70% of normal, which was an improvement over the last five years.The atmospheric rivers began as warm tropical storms that threatened to melt what snow there was. At first they did, but colder arctic are started to move in and the snowpack began to build. After the first set of storms blew through, the statewide snowpack had improved to more than 100% of normal.

And the snow kept falling! The second atmospheric river storm system brought even more snow, and as of today, the snowpack is nearly 200% of normal. If the trend continues (there is NO guarantee of this), we could be on track for a record snowpack. I don't consider it likely, but it would be nice to start recharging the groundwater aquifers that have been severely depleted in recent years.
Source: http://cdec.water.ca.gov/cgi-progs/products/swccond.pdf


The record snowpack should not be seen as evidence that global warming isn't happening. Average temperatures are defiinitely up and have been for several decades. The thing is, snow is snow whether the temperature is 15 degrees or 30 degrees. A not-at-all unusual heat wave could undo the progress in the snow levels. The sky spigot could turn off. After the record flooding of 1997, February and March both provided less than a quarter inch of rain over the entire month. And the drought will never be truly over, as demand outstrips supply even in plentiful years. And little is being done to replenish declining groundwater aquifers.

All in all, though, I'm happier to have plentiful rain rather than crippling drought!

Thursday, January 19, 2017

An Important Read for Californians, from The Center for Investigative Reporting


I'm kind of dropping everything and asking you to read the following article by Nathan Halverson from Reveal: Center for Investigative Reporting (and reposted in the High Country Times) entitled "All This Rain Won't Keep California From Sinking". It very accurately reviews the reasons the current storms are not going to solve California's water problems. The surface water may be okay for awhile, but the water underground is not being replenished, and that is going to have serious repercussions as move into the future. And almonds are a very big part of the problem.

Read the article. The picture I selected is a pasture that I've driven by on my commute to work for the last quarter century. In the last month, it disappeared, and in its place there are thousands, maybe tens of thousands of nut tree saplings. There is no new water to irrigate the orchards; it's being taken from underground aquifers, and in a few years, a decade or two at most, it will be dry and abandoned. And we'll all lose.

Wednesday, January 18, 2017

Liveblogging the Deluge: Atmospheric River Storm Version 2.0

Intellicast radar image of January 18, 2017.
What a strange January it has been. We were hit by the strongest storms in two decades, and there was a spate of flooding and high river flows across much of northern and central California. The storms built up state reservoir levels to a healthy degree, and the snowpack is looking better than it has in many years. The storms were examples of atmospheric river storms, which tap into tropical moisture as they stream across the west coast of the United States, especially California. Such storms are historically the most important source of precipitation across the state.

We had three pulses of precipitation during the event last week, and the first was maybe the most dangerous, as it was particularly warm and dropped heavy rain on the snowpack at elevations as high as 10,000 feet in some areas. This was a recipe for disaster, but luckily the forecasts were accurate enough that most people and communities were aware of the coming floods, and were able to act accordingly. There certainly was damage, but nowhere near the scale of the floods of 1997. The remaining storms added considerably to the snowpack so that by January 14, the statewide snowpack was 150% or more of average. Many of California's reservoirs are at 100% or more of average, with just a few exceptions, including New Melones Lake (67% of normal) and Trinity Lake (82% of normal).

All of this would be a great bit of news in terms of the drought, even if no new storms materialized. But here's the thing: it's about to happen again this week! Another set of atmospheric river storms are taking aim at California, and they will be quite egalitarian, providing a big boost to rain totals in Southern California as well (which got some rain last week, but not to the extent of the north). The first storm is here, and it is raining across the entire state from the Oregon border to Baja.

On the local scene, my backyard rain gauge captured 3.69 inches during the first set of storms, and with a smaller storm earlier in the month, I'd recorded 4.58 inches. That's more than twice the average for January around here, and 0.80 inches has already fallen tonight. 5.38 inches for January makes this the seventh wettest January in the quarter century that I've been measuring. As much as 3 more inches of precipitation is expected in this latest series of storms, so we have the chance of breaking the record for the month (8.60 inches in 2011, according to my records). 

It's worth noting that in 1997, we had the record floods at the beginning of the month, and a second group of intense storms later in January. But after that, literally nothing: 0.25 inches in February, 0.09 inches in March, and 0.19 inches in April. The total precipitation for the year of worst flooding was barely higher than average at 15.43 inches (my local average for 1991-2016 is 13.92 inches).
The Tuolumne River is still running at near flood levels as Don Pedro is drained to make room for coming storms.

It's going to be interesting to see what the rest of the water year holds for us...

Saturday, January 14, 2017

Liveblogging the Deluge: Wrapping Things Up (for now)

A week ago, I looked eastward from my science lab and saw the sun setting on the Sierra Nevada crest from 80 or 90 miles away. It was quite literally moments before the first outliers of the storm arrived and hid the mountains from view. Over the next six days or so, California was pummeled by the worst storm in two decades. Flooding was widespread, and there were some huge changes in my local bailiwick, the drainages of the Merced, Tuolumne, and Stanislaus rivers. I've been able to directly document some out-of-control drainages like Dry Creek, and some barely controlled drainages like the Tuolumne River (short story, flood with Don Pedro dam, 9,000 cubic feet per second; flood without the dam, 45,000 cubic feet per second). I couldn't get up there, but I followed events in Yosemite Valley as the park service prepared for the biggest flood in a long time. One of the most incredible moments of the week was the opportunity that I had to inspect the activity at La Grange Reservoir, where the Tuolumne River was plunging over the dam ramparts at 7,000 cubic feet per second. I also took some video (below) that I wasn't able to post yesterday.


I was out running errands yesterday evening, and as if to bookend the events of the week, the sun once again was shining on the newly fallen snow of the Sierra Nevada crest, this time from Claribel Road between Oakdale and Waterford (the first picture of this post). The storm, the worst in 20 years, was over, and northern and central California began cleaning up the flood damage.

There was an even bigger issue: the California drought. Since 2011, we have been in the grip of the worst drought ever recorded in modern times (megadroughts lasting a century or so are known from the recent geologic past). Three diagrams illustrate the massive changes that have taken place since last year, and since last week.
Reservoir levels Jan 7, 2016
The first diagram (above) shows reservoir storage around the state one year ago. At that time, not a single major reservoir in the state had anything close to normal storage. Most were between 20-36% of capacity, which was barely half of normal in the best of cases. Some were below 15%, including New Melones, at 14%, and McClure at 9%. The picture improved slightly later in the rainy season, but extreme drought conditions still prevailed over 90% of the state.
Reservoir levels, Jan 6, 2017
We had a good start to the rainy season, with a powerful storm arriving in October starting things off early. By the beginning of January, most reservoirs around the state were showing marked improvement. Four of them, McClure, Don Pedro, Shasta, and Millerton, were actually above normal for this time of year. Others were doing "okay", not quite to normal, but better than a year ago by a wide margin.
Reservoir levels today. Source: http://cdec.water.ca.gov/cdecapp/resapp/getResGraphsMain.action
By the end of the storm, all the reservoirs were doing very well, with the sole exceptions of Perris and Castaic, both in Southern California, where considerably less rain fell. All the other reservoirs showed large rises in storage. Lake McClure on the Merced River jumped from 46% to 66% of capacity (145% of normal). Don Pedro increased from 76% to 90% of capacity (134% of normal). Although New Melones Lake lags behind other major reservoirs in the state, it still saw a rise from 27% to 35% of capacity (61% of normal).
Source: http://cdec.water.ca.gov/cgi-progs/products/swccond.pdf
Even better news comes from the snowpack, which increased considerably after the warm start of the storm. Prior to the storm, no part of the Sierra Nevada had a normal amount of snow. In the aftermath of the storm, the snowpack ranges from 132% to 197% of normal for this time of year. If not another flake of snow fell this year, we would be at 74% of a full year (not counting melting and evaporation over the next few months)! And we have three more months of rainy season to come, including another atmospheric river storm arriving in the state on Tuesday (it's not thought to be as powerful, but will be falling on fully saturated ground).

Single storms can make a difference, but even the biggest are not drought-enders. We really need two or more consecutive wet years to start making some inroads in our depleted groundwater basins. But the storm happened and it dumped a lot of rain in California. The drought may not yet be ended, but it looks better right now than it did a year ago.

Liveblogging the Deluge: I've Never Seen Anything Quite This...La Grange Dam

Sometimes you just have to say "what the heck?" (or some other expletive). Some things just grab your attention that way. This was my day to say that. I was privileged to see a rare sight.
I was given the opportunity to accompany some MID employees on an inspection of La Grange Dam. And it was no normal day. We are in the midst of the storm runoff that has the entire Tuolumne River flowing over the rampart of the dam. You are looking at 7,000 cubic feet per second flowing over the brink of a dam 200 feet wide, and 131 feet high (Niagara Falls is only 36 feet higher). It was an astounding sight.
La Grange Dam is located on the Tuolumne River about two miles downstream of Don Pedro Dam. It was built in 1893 to divert the Tuolumne into the irrigation canals of the Turlock and Modesto Irrigation Districts. Most of the time the river does not flow over the lip of the dam. If the water isn't going through the canals, it is piped to the 4 megawatt powerhouse a short distance downstream and released back into the river channel. It's only during major runoff events that the dam overflows in this fashion.
La Grange Dam in quieter times (Source: http://www.turlockjournal.com/archives/29341/)

The dam has a unique structure, being composed in large part of locally quarried metamorphic rock blocks (about 25% of the volume of the dam). The rugged texture of the dam face is distinctive. The rest of the dam is composed of concrete. It holds back a mere 500 acre feet (in contrast, Don Pedro Reservoir upstream has a capacity of 2.04 million acre-feet).
Access to the dam is severely restricted, and the reasons are obvious. The cliffs and slopes around the dam site are dangerously steep, and there are no facilities of any kind.
We walked through a tunnel and got a perspective of the dam from just upstream of the brink (above). It was certainly quieter, but all the more menacing. I was imagining the sudden concern of an errant kayaker realizing that something was amiss just ahead.
We climbed to the top of the hill overlooking the dam for a broader view of things.
One can see the remains of a much older irrigation canal on the hill to the left (south) side of the dam. It dates to the Gold Rush days.
This has been an extraordinary week, with the greatest storm to hit California in twenty years. I've seen some incredible sights in my corner of the world (I've been covering events on the Merced, Tuolumne, and Stanislaus Rivers. But of all the strange new things I've seen, this was in many ways the most stunning. I appreciated the opportunity to witness the deluge.

Thursday, January 12, 2017

Liveblogging the Deluge: Following Up on the Dry Creek Flood

Dry Creek in Modesto flooded to the greatest extent in two decades yesterday, with peak flows exceeding 6,000 cubic feet per second. I was out documenting the flood surge, and I managed to get to the Dry Creek Trailhead ahead of the high water around 4:30 or so. The water was rising but as you can see in the picture above, it had not breached the small levee that kept the river in the channel. I know from other reports that the flood hit a short time after I left.
I was out early this morning, and though the peak of the flood had passed hours earlier, the flow was still high, about 4,000 cubic feet per second, and there was a lot of water covering the flood plain. It was an impressive sight.
Now that the flows in Dry Creek are receding, the dam operators at Don Pedro Reservoir will probably start ramping up their releases from the lake. The goal is to keep flows in Modesto to 9,000 cfs or less to prevent flood damage. The reservoir has been accumulating water with inflows around a high of almost 45,000 cfs to the current 26,000 cfs. The lake stands at 812 feet, or 1,805,600 acre-feet, and has risen 26 feet since the beginning of the storm sequence. Since the lake will fill at 830 feet (2,030,000 acre-feet), it is now at 89% of capacity, and more than 130% of average for this time of year. They will need to free up more space for additional storms and spring runoff

Wednesday, January 11, 2017

Liveblogging the Deluge: "Dry" Creek Takes Center Stage Today

Dry Creek in December of 2016 before the current storms
 What happens when a small insubstantial creek that is dry for much of the year...
...gets hit with a flash flood amounting to 6,100 cubic feet per second? Let's find out!
Dry Creek at about 1,000 cubic feet per second on January 9, 2017

Dry Creek (one of many such "Dry Creeks" in California and elsewhere) is a "minor" tributary to the Tuolumne River that has its headwaters in the lower parts of the Mother Lode northeast of Modesto Reservoir. It actually isn't dry as much as the name might suggest because irrigation overflow keeps some water in the channel during the dry season. But it has no dams or reservoirs to control flows, so it has a history of sudden flashfloods during intense storms. I've been here in Modesto for nearly thirty years, and I've seen several events that resulted in flows of 3,000 cubic feet or so, but only once have I seen flows that approached that which took place today. It was in 1997 during some of the worst flooding ever experienced in Northern California. The opening scene in the video that I posted the other day about the 1997 floods shows Dry Creek in Waterford at that time. Compare that scene with the picture below.
Oakdale-Waterford Highway at high water on January 11, around 6,000 cubic feet per second.
There is only one stream gage on Dry Creek, and it is located downstream in Modesto at the Claus Road Bridge. The peak flow was predicted for around 5 or 6 PM, which meant the surge in Waterford upstream would be several hours earlier. I took these first pictures at the Oakdale-Waterford Highway Bridge at about 2 PM, and the river was indeed very high. Compare to the flow on December 9 in the picture above. The entire floodplain was covered by several feet of water.
A few hours later I headed downstream to see if I could get ahead of the flood crest, and I found high water at the Church Street Bridge north of Empire. The view was astounding. In the picture above one can see how entire orchards are under water. And it wasn't standing water, either. The entire channel was flowing rapidly downstream.
I then went just a few miles west to the Claus Road Bridge, and found that the highest flows had not yet arrived! The Dry Creek Trail had been closed because some portions were already under water, and the creek was expected to rise another couple of feet. I walked down to the river edge and found a sheriff's deputy and a crew from the office of emergency services who were using a drone to take video of the coming flood. Modesto friends: let me know if you see the videos posted anywhere!
It started raining again, and it was getting darker, so I headed east again to check out some of the other bridges.
Wellsford Road bridge was the most interesting. The main channel was moving fast, and the muddy water reminded me of running the Colorado River through the Grand Canyon a few years back. Not because of any canyon walls, of course, but because of the surging muddy water with eddies and whirlpools. The flows weren't all that much different; Dry Creek was at 6,000 cfs, and most of the time the Colorado was running at about 15,000 cfs. The big difference is that the Colorado flows at that rate more or less the entire year, and Dry Creek does it once in a generation! I found a bit of information somewhere (source has been forgotten) that suggested that about once every 500 years a flood on Dry Creek could exceed 18,500 cubic feet per second. It would be something to see something like that happen, but such a flood would do incredible damage, and I wouldn't wish such a thing on anyone.
The morning will tell if there has been any serious damage downstream. The dangers of flooding are well-known today, but a number of very nice homes were built decades ago along the lower reaches of Dry Creek near the confluence with the Tuolumne. The dam operators at Don Pedro Reservior work very hard to modulate flows of the Tuolumne River to prevent the combined flows of the two rivers from exceeding 9,000 cubic feet per second. If flows go any higher, water backs up in Dry Creek, causing flooding in the neighborhoods there.
I head to work before sunrise, but I'll probably try to catch a few more photographs in the morning. It will take a day or so for flows to recede.